Background
Connectivity is the degree to which the landscape facilitates or impedes movement between suitable habitat patches. Greater habitat connectivity means animals are able to travel between patches, which is beneficial for species as it allows for gene flow and movement in response to environmental disturbances. Modeling connectivity helped us determine which areas within the corridor should be prioritized for conservation and where restoration efforts will improve connectivity.
Building the Model
To model connectivity we needed to understand how gorillas move across the landscape. We did this by creating a resistance surface raster, which is a file that assigns values to features in the landscape that indicate how difficult it would be for a gorilla to move through an area.
We then used this resistance surface raster to run three analyses to model connectivity:
We then used this resistance surface raster to run three analyses to model connectivity:
- We identified the least cost path, which is the least energetically costly route, and the surrounding least cost corridor between the reserves.
- We found key locations where gorillas must move through a constricted area to cross the landscape.
- We determined current obstacles to gorilla movement along and near the least cost path.
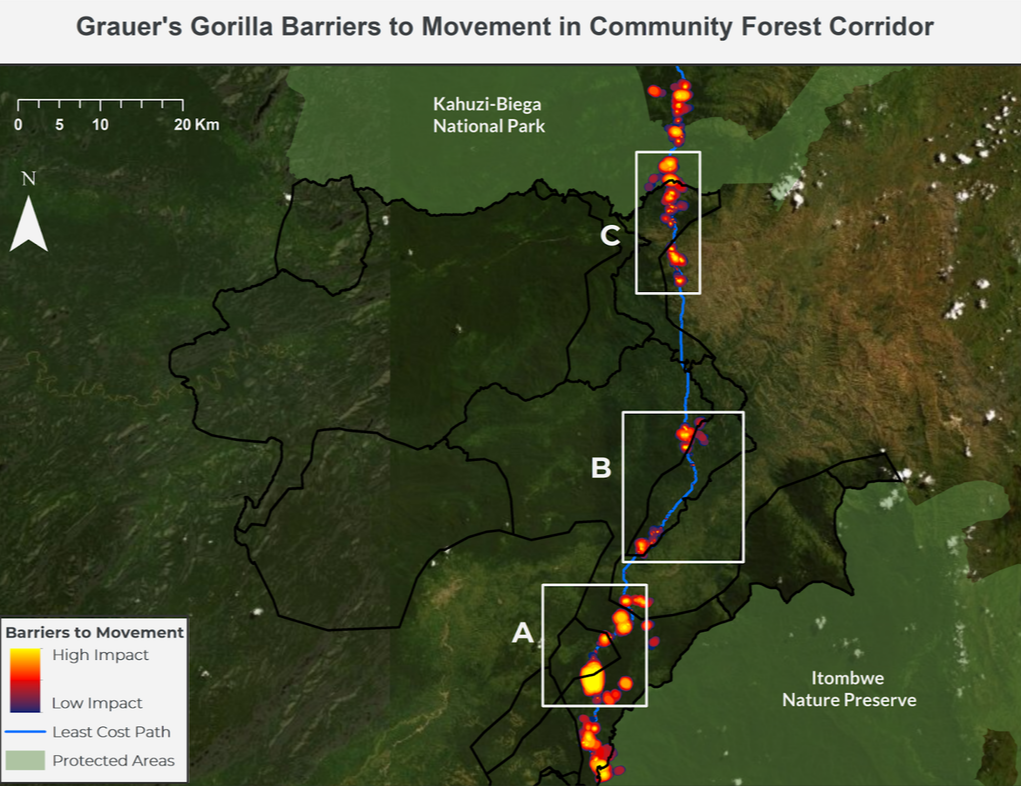
Click image to enlarge.
|
Barriers in the Kahuzi-Biega-Itombwe corridor. Barriers to gorilla movement along and adjacent to the least-cost-path (blue line) are displayed as yellow circles. The size of the yellow circles represent the size of the barrier. Restoring barriers along the LCP would strengthen the existing corridor, while restoring barriers that do not intersect the LCP (shown to the east of point A) would alter the route of the corridor. Areas A, B, and C highlight the three proposed reforestation zones that have barriers of high restoration potential.
|
Model Results
The connectivity model highlights critical areas for movement, the locations where movement is constricted (pinch points), and barriers to movement between the two protected areas for Grauer’s gorillas. Areas within the corridor that are easiest for gorillas to traverse are primarily located in the corridor's eastern section (shown in green on the figure below). The small section of the proposed corridor that narrows between the respective northern and southern portions is the vital to Grauer’s gorilla connectivity. The loss of this area could sever gorilla movement between the protected areas (shown in red on the figure below). In addition, we found several barriers to gorilla movement within three of Strong Roots’ proposed reforestation zones.
|
Grauer’s gorilla connectivity results in the Kahuzi-Biega-Itombwe corridor. Green areas represent areas of lower movement cost and higher connectivity. Yellow areas represent areas of higher movement cost and lowest connectivity. The least-cost-path, shown in blue, represents the lowest cost-weighted-distance route between the Kahuzi-Biega and Itombwe. The map also highlights critical habitat connections (A, B, C) where flow becomes constricted, called pinch points, between the two protected areas. Red areas are those of high concentration of current, where movement concentrates into a constricted area.
|
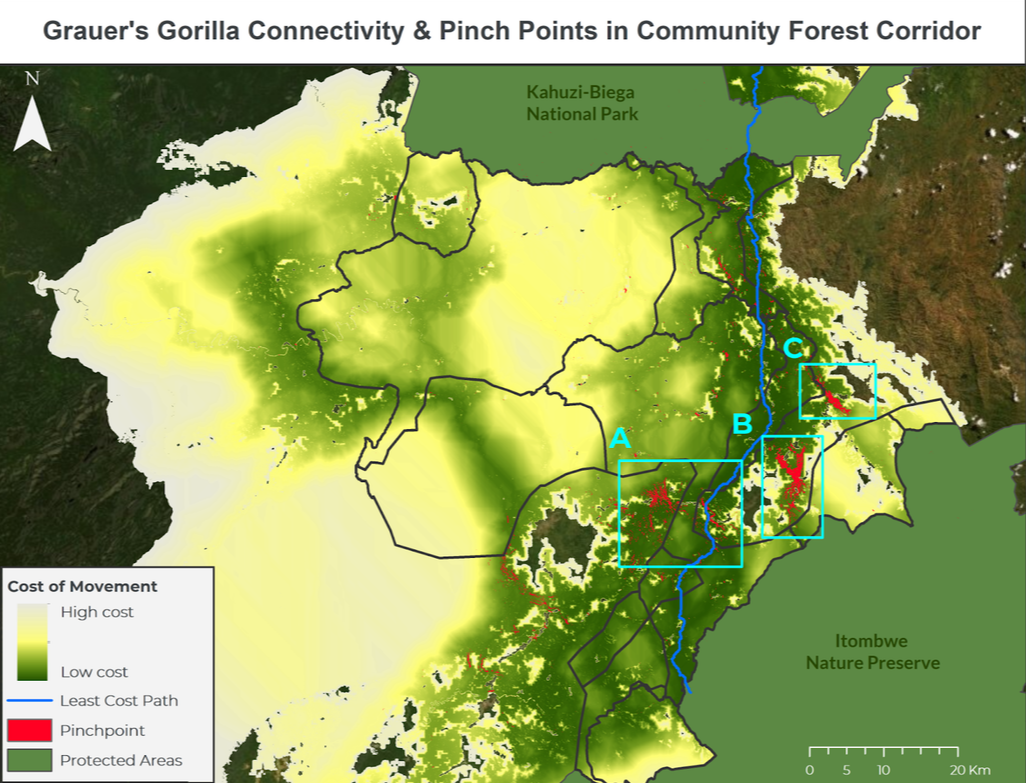
Click image to enlarge.
|
Takeaways
These results allow us to identify where conservation efforts should be focused to preserve current connectivity. The conservation of the identified high connectivity areas and pinch points will protect and promote Grauer’s gorilla movement within the Kahuzi-Biega-Itombwe corridor. Likewise, impending restoration efforts in these Strong Roots reforestation zones are expected to reduce the difficulty for gorillas to move through the area, and thus promote Grauer’s gorilla movement within the proposed corridor.
